Understanding the Relative Strength Index (RSI) Indicator: A Comprehensive Guide
Introduction to the Relative Strength Index (RSI)
The Relative Strength Index (RSI) is a widely used momentum oscillator that measures the speed and change of price movements. Developed by J. Welles Wilder Jr. in 1978, this technical indicator helps traders and analysts evaluate whether an asset is overbought or oversold. By providing a quantitative value, the RSI empowers traders to make informed decisions in their trading strategies.
How the RSI Works
The RSI operates on a scale ranging from 0 to 100, with key thresholds at 30 and 70. Traditionally, an RSI reading below 30 suggests that an asset may be oversold, indicating a potential buying opportunity. Conversely, a reading above 70 signifies that the asset may be overbought, potentially indicating a selling opportunity. These thresholds are pivotal in the analysis process and help traders ascertain when to enter or exit a position.
The calculation of the RSI involves comparing the average gains and losses over a specified period, typically 14 days. The formula used is:
RSI = 100 - (100 / (1 + RS))
Where RS (Relative Strength) is the average gain of up periods during the specified time frame divided by the average loss of down periods. As a momentum indicator, the RSI can also identify bullish or bearish divergences, thereby enhancing the depth of technical analysis.
Interpreting the RSI Chart
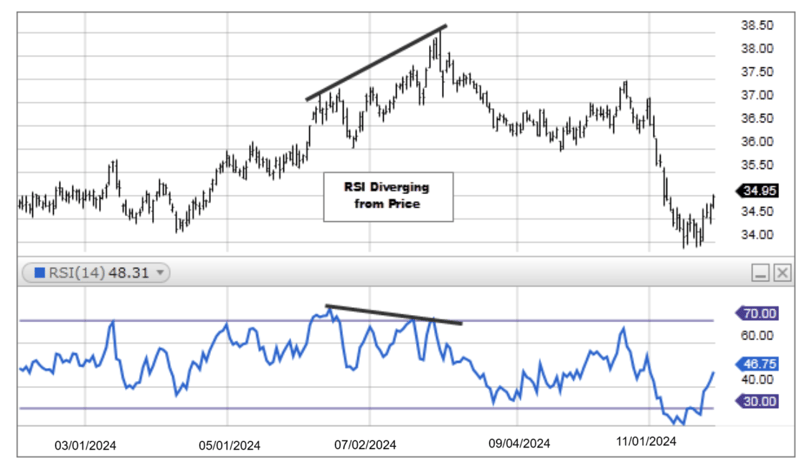
To effectively utilize the RSI, it is crucial to interpret its chart accurately. Traders often look for divergence signals, where the price action of the asset moves in the opposite direction of the RSI. For instance, if prices are making new highs while the RSI fails to surpass its previous high, it may indicate a weakening trend, thereby prompting traders to exercise caution.
Additionally, the RSI can be applied in conjunction with other technical indicators to bolster trading strategies. Combining the RSI with moving averages, for example, provides a more robust framework to analyze price actions comprehensively. An understanding of these relationships between price movements and the RSI can significantly impact decision-making processes in trading.
Conclusion
The Relative Strength Index (RSI) remains an essential tool in the arsenal of traders and analysts alike. By understanding its mechanics and applications, one can enhance their ability to navigate the complexities of financial markets. Its simplicity in calculation and interpretation makes it a favored choice to identify potential entry and exit points. As we engage with this indicator, it is critical to combine it with a broader trading plan, ensuring a well-rounded approach to market analysis.
Connect
Join us for financial insights and support.
Support
© 2025. All rights reserved.