Understanding the MACD Indicator: A Comprehensive Guide
Introduction to the MACD Indicator
The MACD, or Moving Average Convergence Divergence, is a popular technical analysis tool used by traders to evaluate the momentum and direction of an asset's price. Developed by Gerald Appel in the late 1970s, the MACD has become a staple in many trading strategies due to its effectiveness in predicting price movements. This blog post will delve deeper into the MACD indicator, exploring its components, interpretation, and how to utilize it effectively in trading.
Components of the MACD Indicator
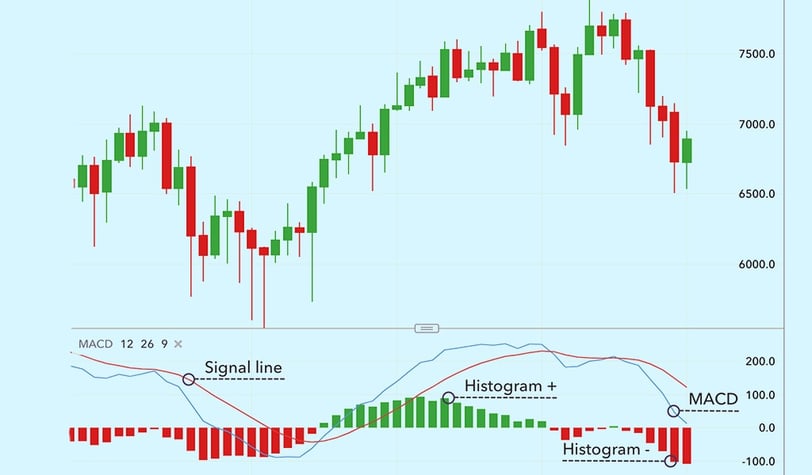
The MACD consists of three main components: the MACD line, the signal line, and the histogram. The MACD line is derived by subtracting the 26-period Exponential Moving Average (EMA) from the 12-period EMA. This calculation helps traders identify the momentum of the price movement. The second component, the signal line, is typically a 9-period EMA of the MACD line. It is used to generate buy or sell signals when the MACD line crosses over or under it. Finally, the histogram represents the difference between the MACD line and the signal line, providing a visual representation of the momentum between these two lines and enhancing the trader's insights.
Interpreting the MACD Indicator
Interpreting the MACD indicator involves analyzing the relationships between the MACD line, the signal line, and the histogram. A bullish signal is generated when the MACD line crosses above the signal line, indicating potential upward momentum in the price. Conversely, when the MACD line crosses below the signal line, it signifies a bearish trend, suggesting a potential decline in price. Traders often look for divergences between the MACD and the asset's price. For example, if the price is making new highs while the MACD is not, it could indicate a weakening trend, prompting traders to reconsider their positions.
Moreover, the histogram facilitates quick visual analyses of the strength of the trend. A rising histogram signals increased momentum, while a falling histogram can suggest a weakening trend. By utilizing these components and signs together, traders can employ the MACD to enhance their decision-making processes.
Practical Applications of the MACD Indicator
The MACD indicator is versatile and can be applied across various trading styles, from day trading to long-term investing. Traders often combine the MACD with other technical analysis tools, such as support and resistance levels, to develop a more comprehensive trading strategy. For example, using the MACD in conjunction with the Relative Strength Index (RSI) can further validate potential trade opportunities.
However, it is crucial to remember that no indicator is foolproof. The MACD, like any tool, has its limitations and can provide false signals during volatile market conditions. Therefore, traders should always consider incorporating risk management techniques into their trading plans, ensuring they minimize potential losses while maximizing their chances of success.
In conclusion, the MACD indicator is an invaluable resource in the arsenal of many traders. Understanding its components and how to interpret its signals can empower traders to make informed decisions, optimize entry and exit points, and enhance their overall trading effectiveness.
Connect
Join us for financial insights and support.
Support
© 2025. All rights reserved.