Understanding the Pivot Points Indicator: A Comprehensive Guide
Introduction to Pivot Points
The pivot points indicator is a vital tool in the arsenal of traders and market analysts, utilized for identifying potential support and resistance levels in the market. By applying mathematical calculations based on high, low, and close prices from the previous trading session, pivot points effectively forecast future price movements. This guide aims to explore the significance and usage of the pivot points indicator, empowering traders to make informed decisions.
How to Calculate Pivot Points
To calculate pivot points, the following formulas are generally used:
- P = (H + L + C) / 3: The main pivot point (P) is derived from the average of the high (H), low (L), and close (C) prices of the previous trading session.
- Support and Resistance Levels: Once the pivot point is established, additional levels can be calculated as follows:
- Support 1: S1 = (2 * P) - H
- Support 2: S2 = P - (H - L)
- Resistance 1: R1 = (2 * P) - L
- Resistance 2: R2 = P + (H - L)
These calculations form the foundation of the pivot points indicator, allowing traders to identify strategic entry and exit points in their trades.
Utilizing Pivot Points in Trading Strategies
Implementing the pivot points indicator into trading strategies can enhance decision-making. For instance, if the price approaches resistance levels, traders might consider it a potential selling opportunity, whereas approaching support levels may signal a buying opportunity. Additionally, incorporating other technical indicators may further validate these signals.
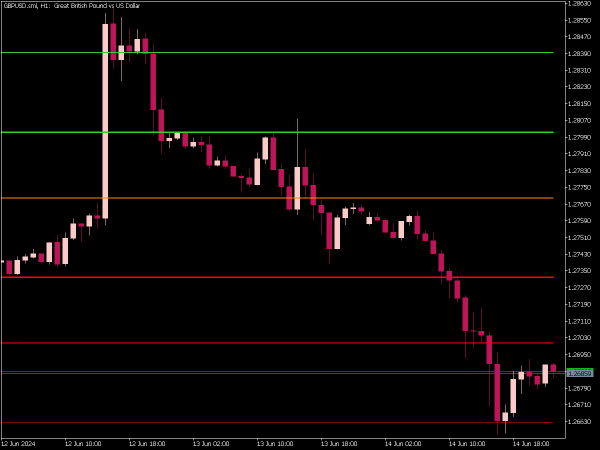
Visual representation is also a crucial part of strategic implementation. Traders often use charts where the pivot points and its derived support and resistance levels are marked. This visual aid allows traders to easily discern price action in relation to these significant levels, facilitating quicker decision-making processes.
Moreover, the determination of trend direction can be enhanced by observing the price relative to the pivot point. For example, if the price trades above the pivot point, it may indicate a bullish sentiment; conversely, trading below may suggest a bearish trend. This interplay between price and pivot points is vital for developing a robust trading strategy.
Conclusion
The pivot points indicator serves as a fundamental tool for traders keen on navigating market movements with precision. By understanding its calculations and effectively applying this knowledge to trading strategies, investors can significantly enhance their market analysis. With proper implementation and an eye for detail, the pivot points indicator can be transformative in achieving trading success.
Connect
Join us for financial insights and support.
Support
© 2025. All rights reserved.