Understanding Bollinger Bands: A Comprehensive Guide
What are Bollinger Bands?
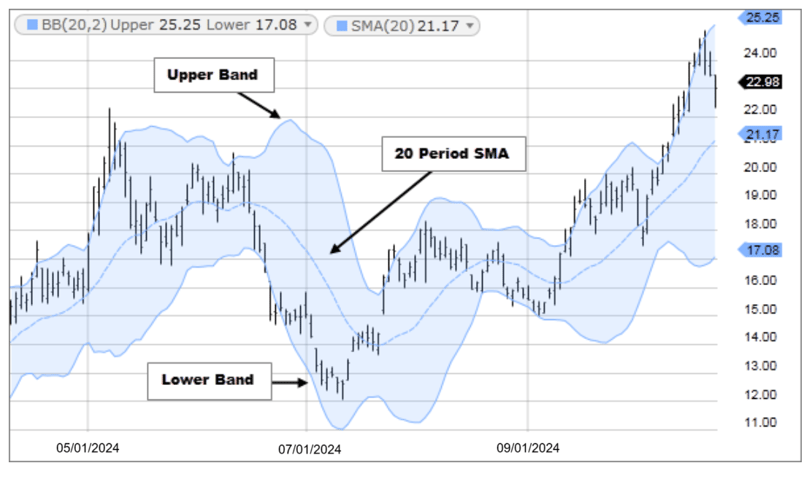
Bollinger Bands are a technical analysis tool created by John Bollinger in the 1980s. These bands consist of three lines: a middle line, which is a simple moving average (SMA), and two outer bands that are standard deviations away from this average. They are used by traders to measure market volatility, identify trends, and ascertain overbought or oversold conditions.
How to Read Bollinger Bands
Reading Bollinger Bands requires understanding the relationship between the price of an asset and the bands themselves. The middle band represents a 20-period SMA, while the outer bands typically represent two standard deviations above and below this average. In general, when the price approaches the upper band, it signals an overbought market, potentially indicating a reversal or pullback. Conversely, when the price nears the lower band, the market may be considered oversold.
Using Bollinger Bands in Trading Strategies
Bollinger Bands can be effectively integrated into various trading strategies. For instance, one popular method is the “Bollinger Bounce,” where traders look for price reversals at the outer bands, betting on a return to the middle SMA. Another approach combines Bollinger Bands with other indicators, such as Relative Strength Index (RSI), to confirm entry and exit points. The visual representation of the bands helps traders make informed decisions by highlighting potential price movements.
In conclusion, the Bollinger Bands indicator is a vital tool for both novice and experienced traders. It enhances the technical analysis process by providing insights into market volatility and trend dynamics. Understanding how to properly read and implement this indicator can refine your trading strategy, leading to informed decisions and, ultimately, greater trading success.
Connect
Join us for financial insights and support.
Support
© 2025. All rights reserved.